Apache JMeter is a load test tool commonly used for web server performance testing. There are lots of tutorials available regarding the use of JMeter. However, I found few guides have mentioned using Kerberos as a means of user authentication with JMeter, even though the tool perfectly supports it – in case you have not heard of it, Kerberos is a authentication protocol typically used for authenticating domain-joined clients when they are visiting intranet web applications. If you find it difficult to make JMeter work with Kerberos authentication, you may find this a step-by-step guide useful.
Setting up the environment
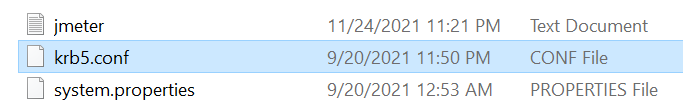
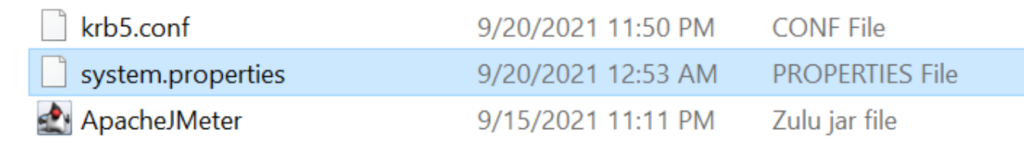
There are a number of pre-requisites to use JMeter for benchmarking a Kerberos web application. Remember to check the following configuration files before running the JMeter application.
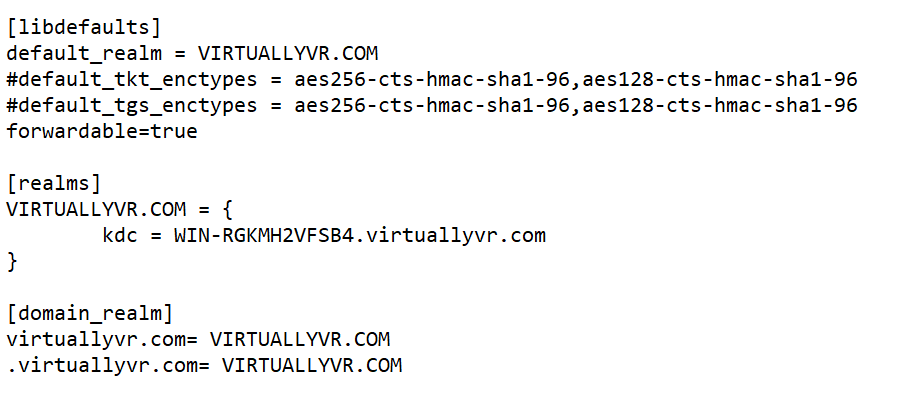
#1) Edit krb5.conf
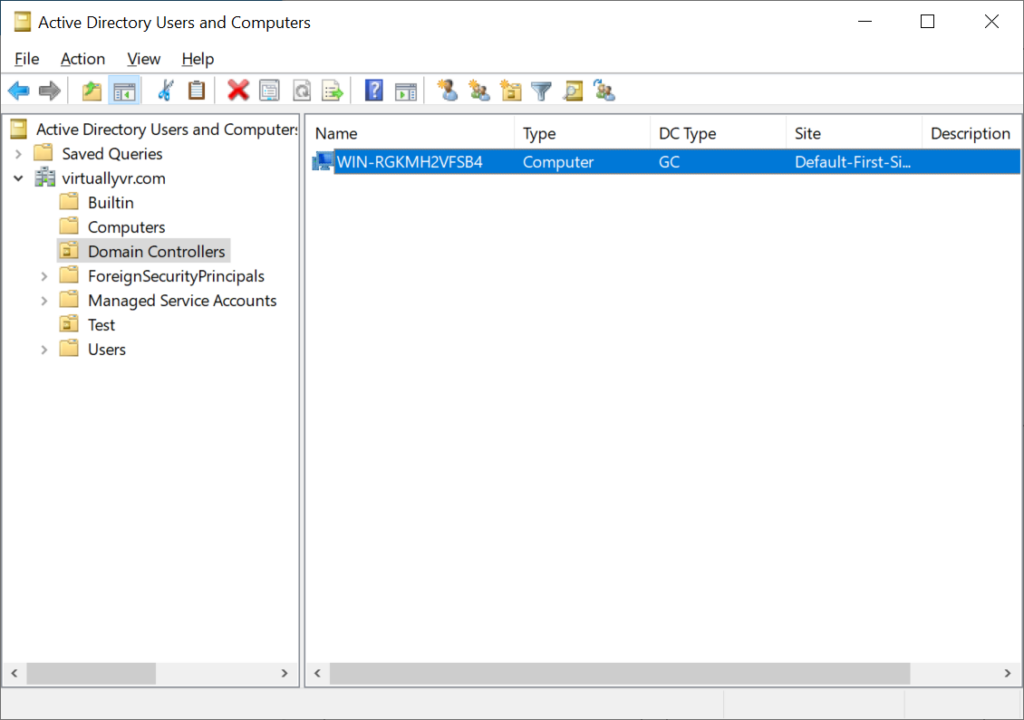
Edit krb5.conf file and change the configuration according to your Active Directory (AD) environment:
#2) Edit system.properties
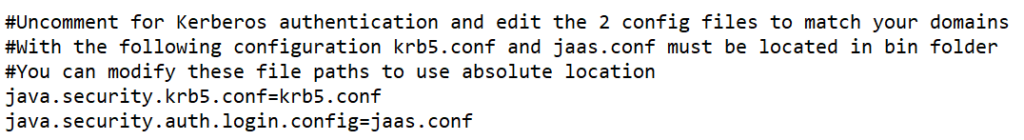
Open system.properties file and uncomment the following lines:
java.security.krb5.conf=krb5.conf
java.security.auth.login.config=jaas.conf
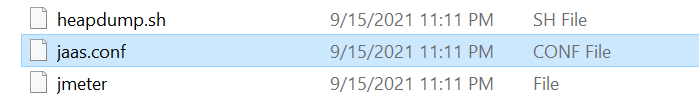
#3) Edit jaas.conf
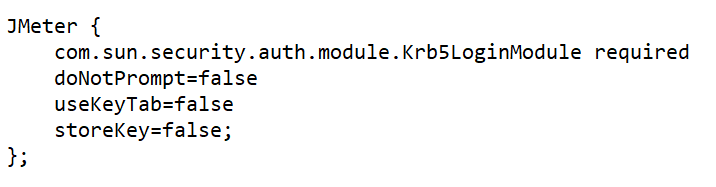
Check that the JAAS configuration file is set to load the Krb5LoginModule when running JMeter:
Other Tips
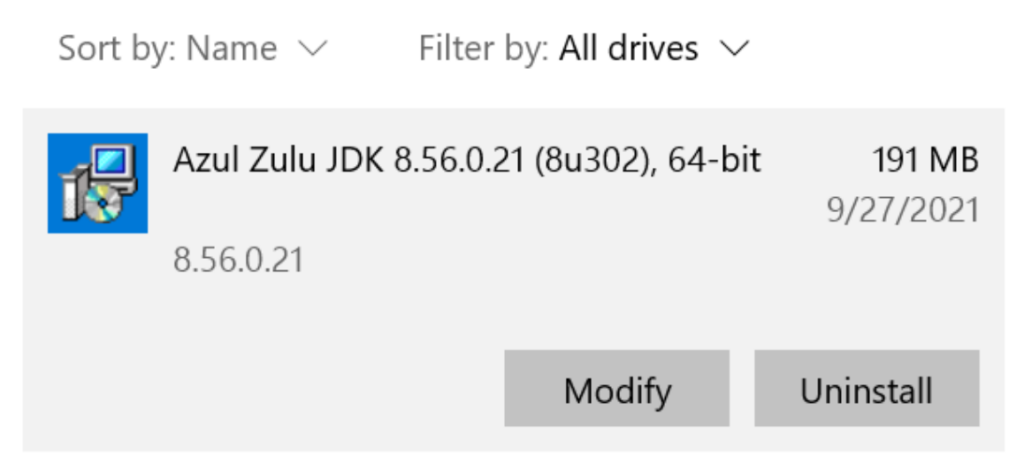
Tips #1: You must install Java before starting JMeter application
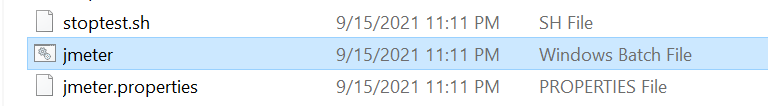
Tips #2: Edit jmeter.bat to assign more system memory to JMeter application for running test cases
The Java HEAP size may need to be increased in order to avoid Java application running out-of-memory when running test cases.
After editing the jmeter batch file via Notepad, you can run the batch file and start the JMeter application in GUI mode.
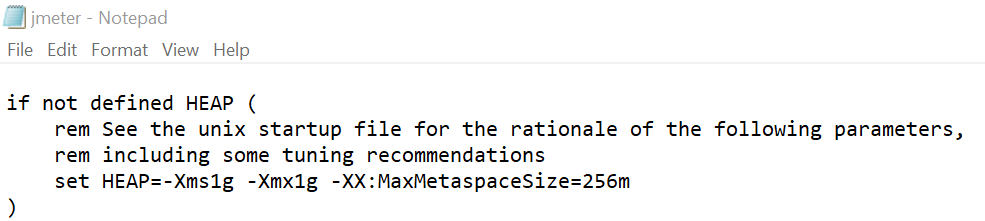
if not defined HEAP (
By default only 1GB is configured for Java memory allocation. The above example demonstrates that 4GB of system memory can be allocated to Java HEAP.
rem See the unix startup file for the rationale of the following parameters,
rem including some tuning recommendations
set HEAP=-Xms1g -Xmx4g -XX:MaxMetaspaceSize=4096m
)
Creating a JMeter Test Plan (.jmx)
Step 1) The Initial Test Plan Configuration
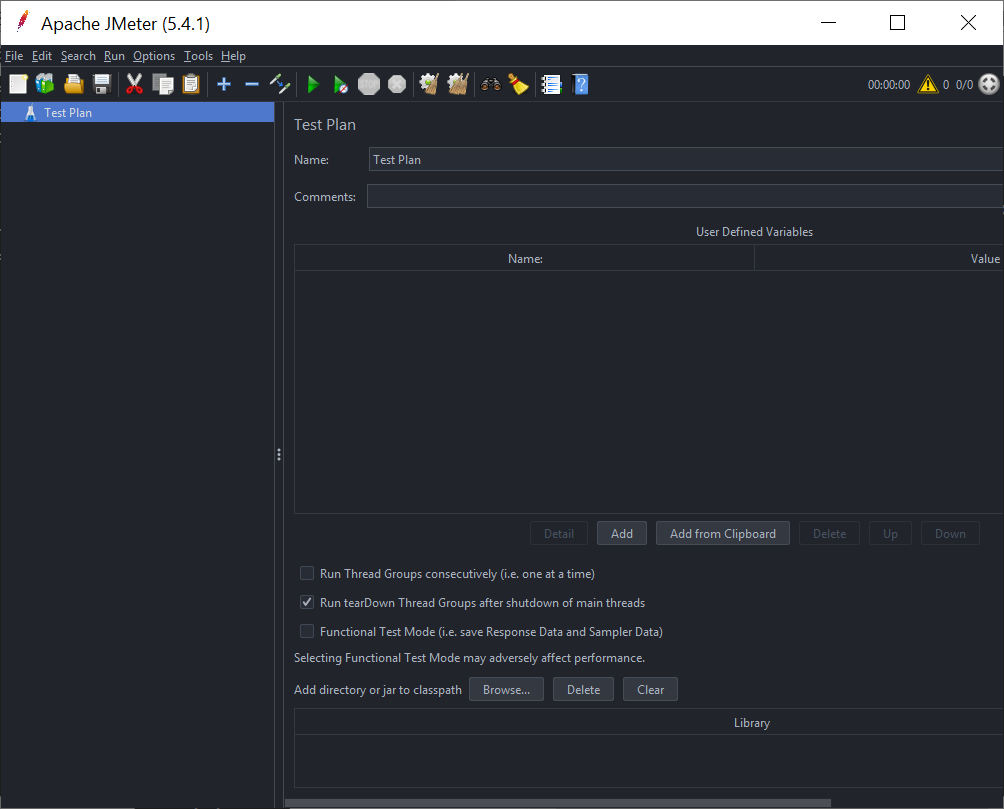
For the initial launch, JMeter displays a Test Plan with no element.
Step 2) Add a Thread Group
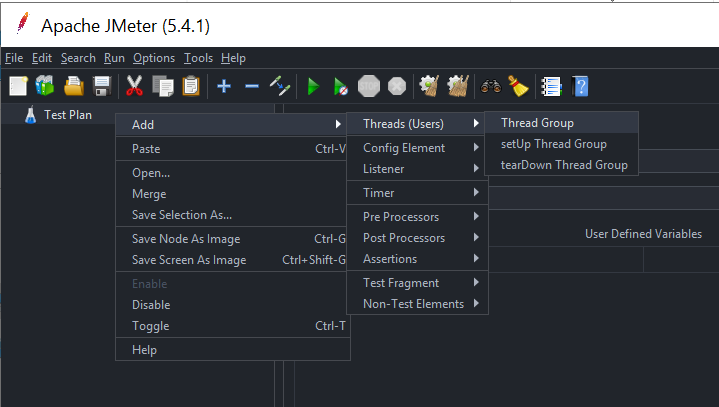
To begin with, add a “Thread Group” element under Test Plan by right clicking “Test Plan”. Hover to “Add” and “Threads (Users)”. Select “Thread Group”.
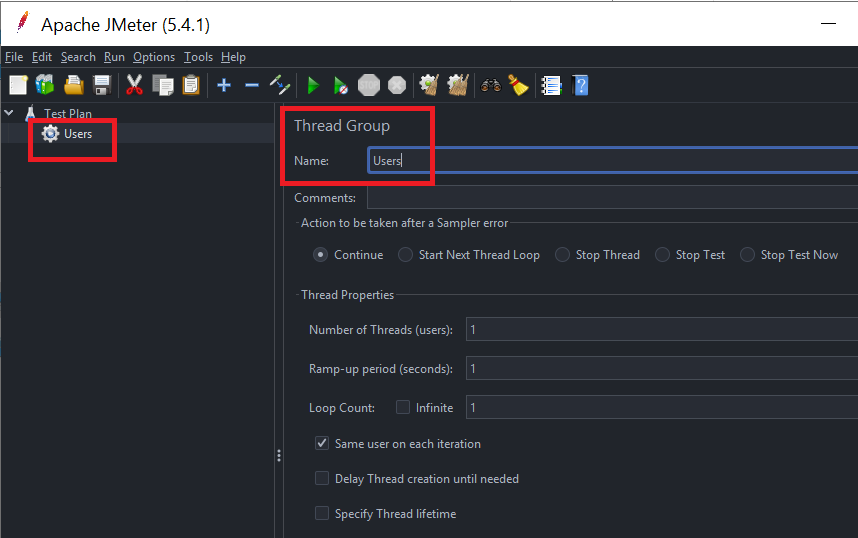
Optional: You can change the “Thread Group” element name to another one by specifying it in the “Name” field.
Step 3) Add a HTTP Authorization Manager
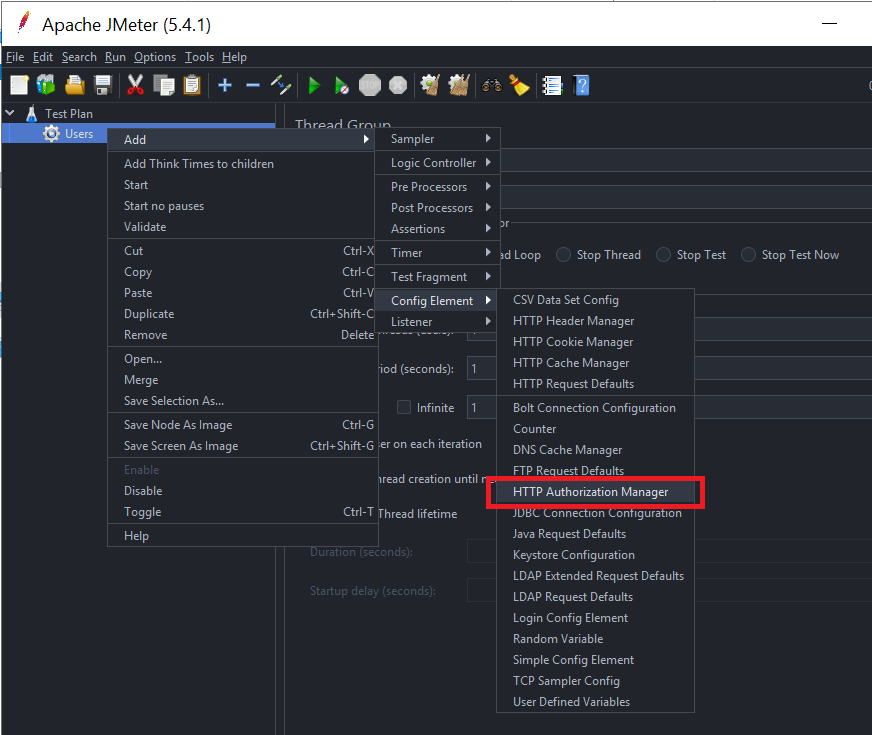
Next, add a “HTTP Authorization Manager” element under the “Thread Group” element.
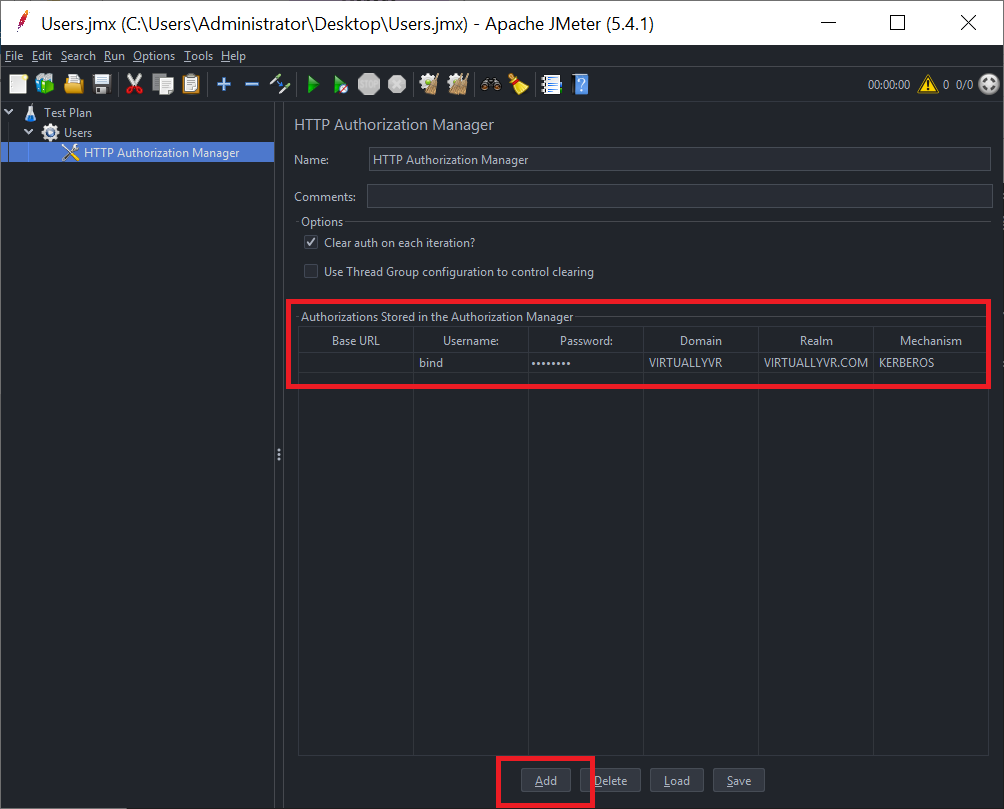
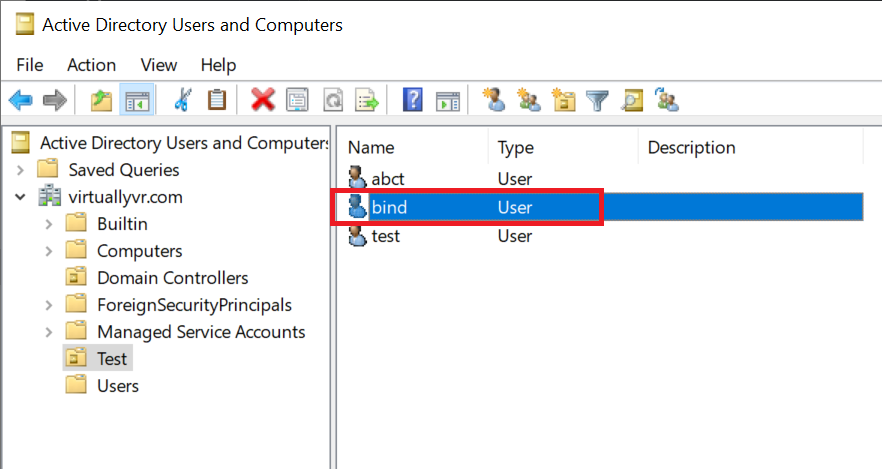
In the “HTTP Authorization Manager”, click “Add” and fill in user credential, domain and realm information. Remember to change the mechanism to Kerberos.
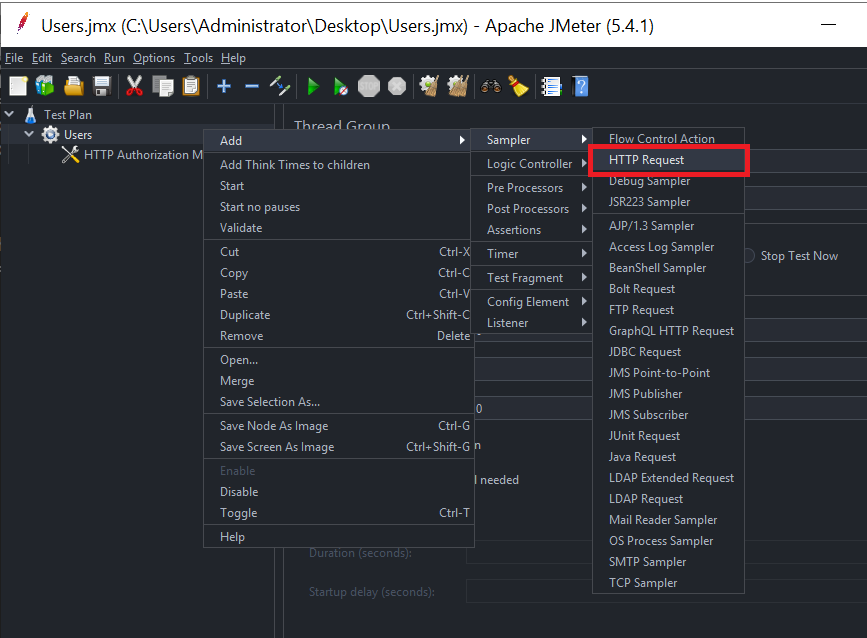
Step 4) Add a HTTP Request
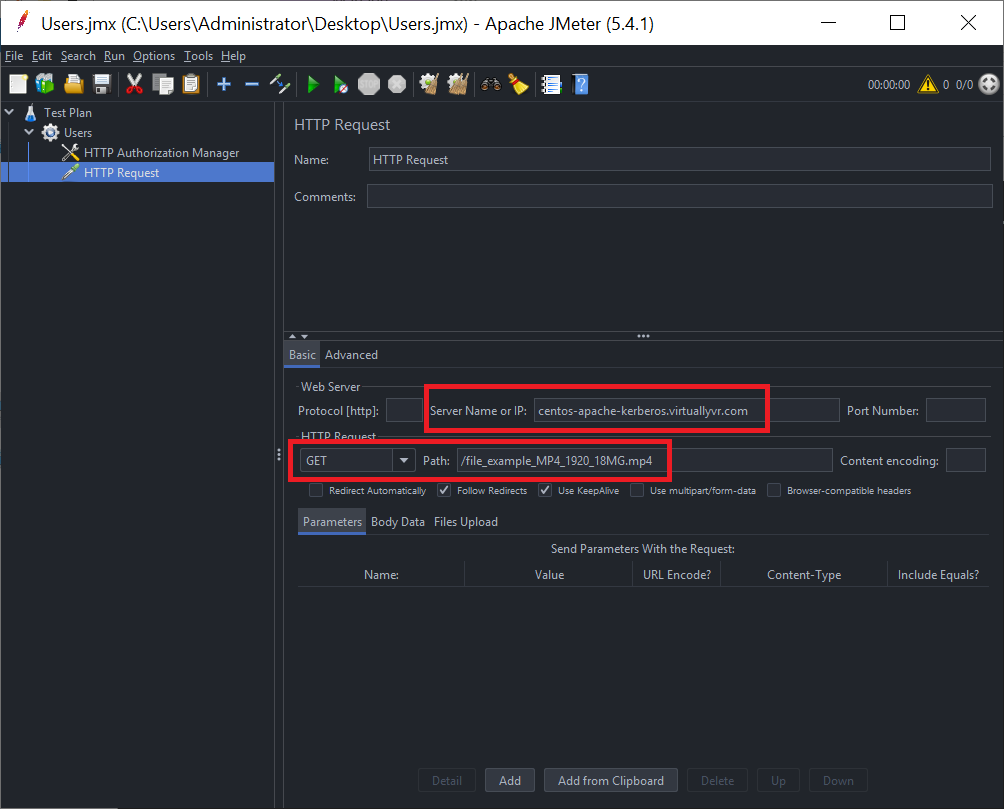
After that, add a “HTTP Request” element under the “Thread Group” element.
After adding the “HTTP Request” element, you can fill in your web server URL path.
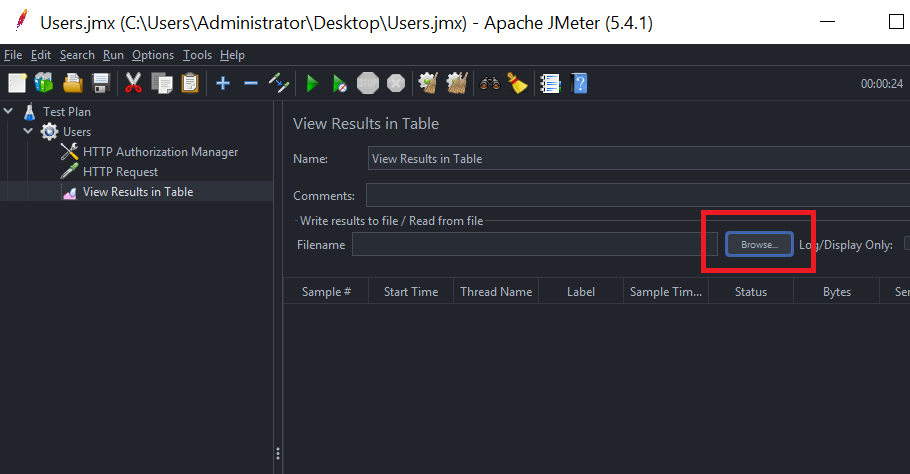
Step 5) Add a Listener – “View Results in Table”
Finally, add a listener to store the results in CSV format
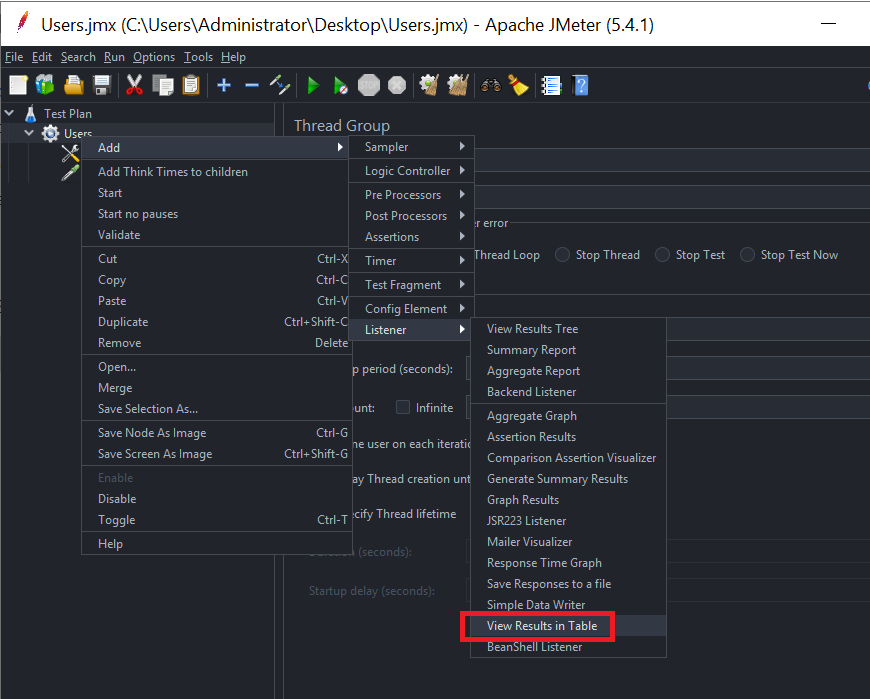
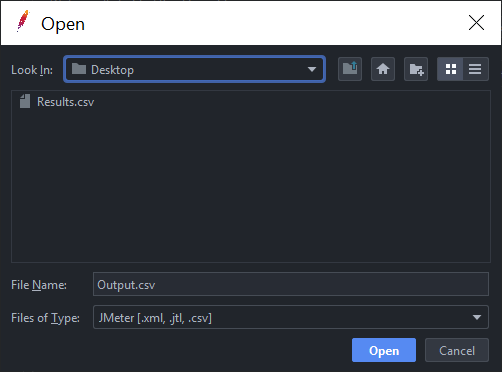
Upon adding the “View Results in Table” listener, a new page will be shown on the right hand side, select browse button and specify the file name, format and file path of your choice. Remember to add the file extension after the file name (like .csv).
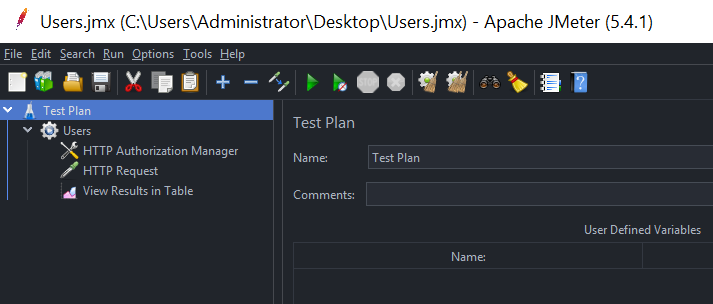
The Final Test Plan Configuration
After all elements are added to the test plan, we are ready to launch the benchmark.
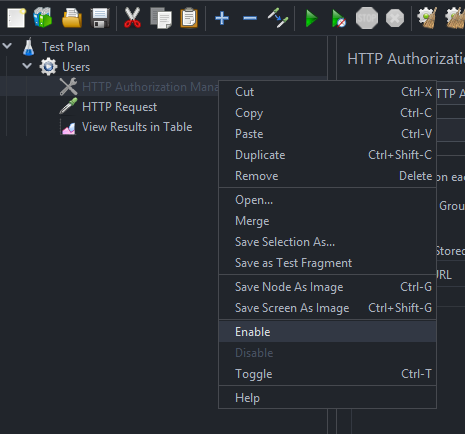
Other Tips:
Tips #1: Remember to enable all necessary elements. By default, elements are enabled when added to JMeter test plan. It goes without saying that if you accidentally disabled an element, JMeter will skip the element when running.
Sample Results
If there is no configuration error, green icons will be shown under the status column after running the test script.
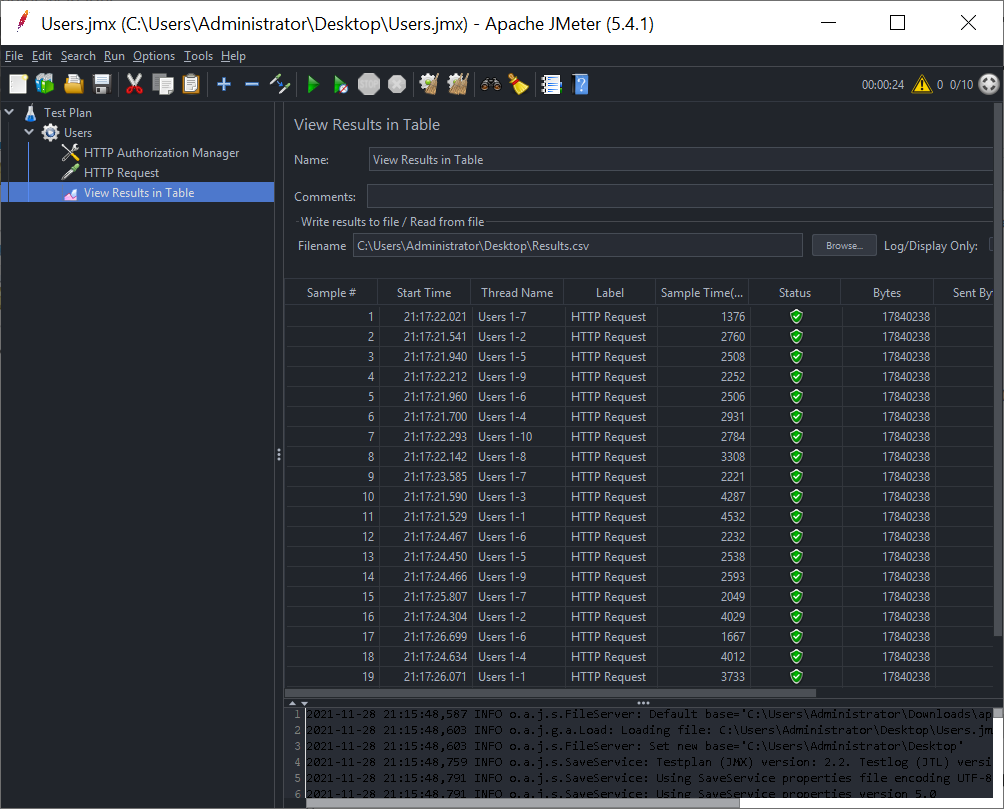
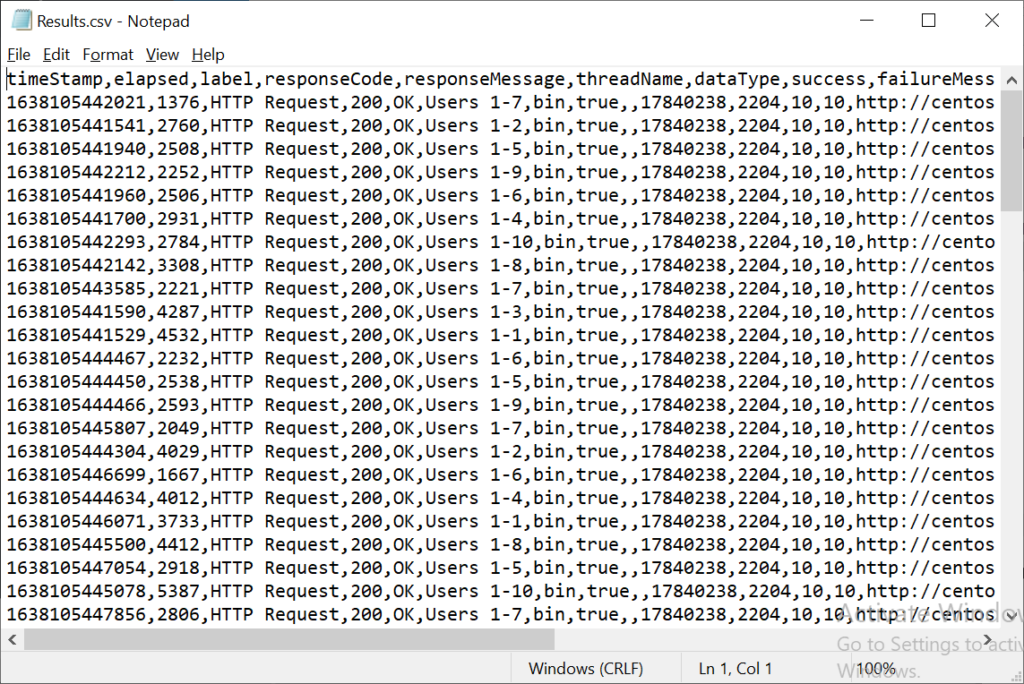
The detailed test results will also be written to the specified file format
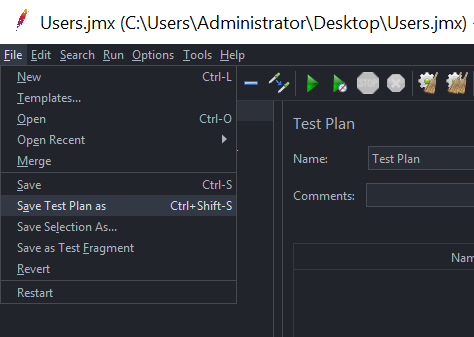
Save the Test Plan in a JMX file
After confirming the desirable test result can be generated, save the test plan in a JMX file format via “File”, “Save Test Plan As”.
Run the Test Plan in CLI mode
Lastly, the test plan created via the JMeter GUI mode can be used by the application in CLI mode.
Why use CLI mode to run actual JMeter test plan?
As per official guideline, CLI mode should be used for actual load testing. For the GUI mode, it should only be used for creating a test plan (.jmx). You should always use Windows Command Prompt or Linux Terminal to run the test plan.
jmeter –n –t Test_Plan.jmx –l log.jtl
A sample command for running the test script in CLI mode, where “-n” means CLI mode; “-t” means the JMX file name and “-l” means the log result output. Replace “Test_Plan” with the your file name.
For more information about the parameters, please refer to JMeter user manual:
https://jmeter.apache.org/usermanual/get-started.html
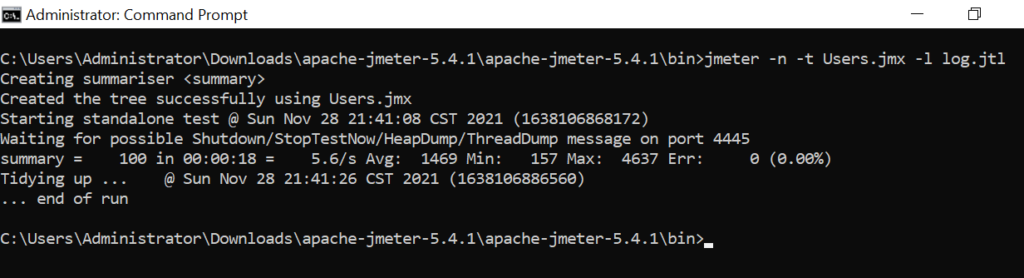
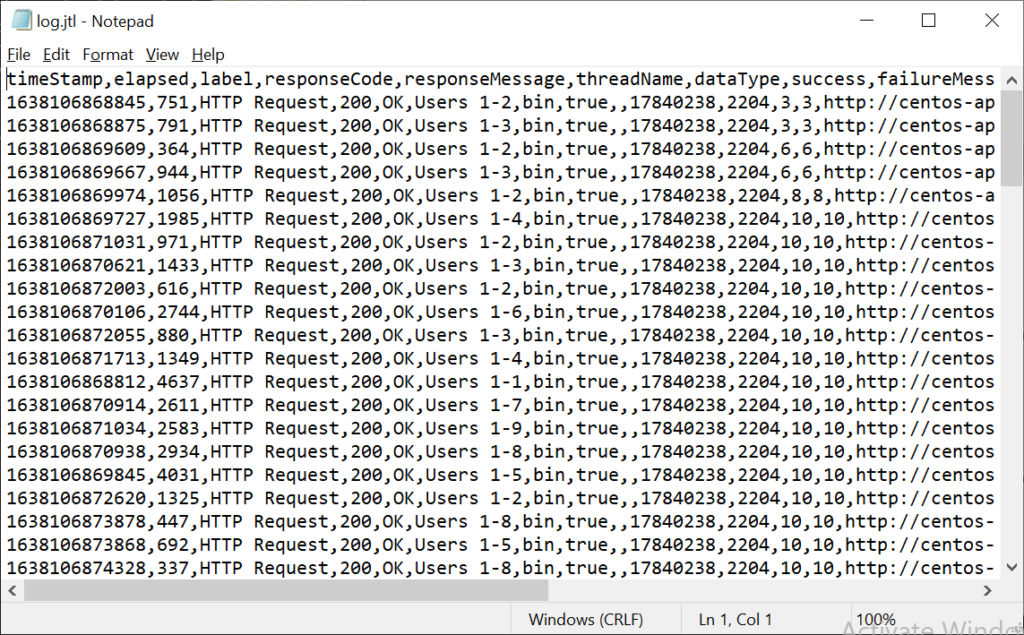
After running the above command, a log.jtl file will be generated. You can find a sample test result shown as follows: